3.2. Random distribution
Random spatial distribution is simulated using poisson distribution.
Simplest example: 100 people are fishing in the same lake for the same time (e.g. 3 h); they have equal probability to catch a fish per unit time.
Question: How many fishers catch 0, 1, 2, 3 etc. fish?
captured, i | fishers n(i) | of fishers p(i) | distribution n'(i)=Np'(i) |
| 0 | 11 | 0.11 | 10 |
| 1 | 25 | 0.25 | 23 |
| 2 | 21 | 0.21 | 27 |
| 3 | 25 | 0.25 | 20 |
| 4 | 9 | 0.09 | 12 |
| 5 | 7 | 0.07 | 5 |
| 6 | 2 | 0.02 | 2 |
| 7 | 0 | 0.00 | 1 |
| Total | N=100 | 1.00 | 100 |
Mean number of fish captured by 1 fisher, M = 2.30, and standard deviation, SD = 1.41.
Poisson distribution is described by equation:

where m is the mean and i!= 1×2×3× ... ×i, 0!=1; 1!=1.
Theorem: In poisson distribution, mean = variance: 
Two main methods of parameter estimation
- Method of moments (m = M)
- Non-linear regression (iterative approximation)
Chi-square test is used to test if sample distribution is different from theoretical distribution. The equation is:

where n(i) is the sample distribution (e.g., the number of fishers that captured i fish), and n'(i) is theoretical distribution (e.g., expected number of fishers that captured i fish according to poisson distribution). In our example,

The number of degrees of freedom is equal to the number of distribution classes (7 classes in our example) minus the number of parameters that were used to adjust the theoretical distribution to the sample distribution. We used 2 parameters: m=2.3 and N = 100. Thus,
Critical value for chi-square for df = 5 and P = 0.05 is 11.07.
Conclusion: Sample distribution does not differ significantly from the poisson distribution.
Note. Chi-square test cannot prove that sample distribution is the same as the theoretical distribution! If there is no significant differences, it may mean two things: sample distribution is really very close to the theoretical distribution, or there may be just not enough data to distinguish these distributions. Suggestion: Use multiple hypothesis, i.e., compare sample distribution with several theoretical distributions.
Relationship between fishers (our example) and spatial distribution. Imagine, we sample a population by counting organisms in sample areas (e.g., 1 sq.m.). Then, each sample area is equivalent to a fisher and the number of organisms found is equivalent to the number of fish captured. The notion "random distribution" can be defined using the model of random deposition of individual organisms. We start from empty space and put the first organism by random selection of its coordinates. The organism may end in a sample area (=fish captured). Then we add the second organism, and so on.
Thus, the proportion of samples in which i organisms were found will correspond to the poisson distribution.
Quick test for the type of spatial pattern:
Coefficient of dispersion:
if CD << 1 then regular distribution
if CD » 1 then random distribution
if CD >> 1 then aggregated distribution
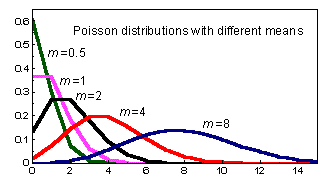
Poisson distributions are asymmetric at low mean values, and almost symmetric at higher mean values:

When mean increases to infinity, poisson distribution coincides with a normal distribution.


