Lab. 8. Parasitism and Biological Control

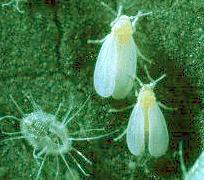
Parasitoid, Encarsia.formosa (Hymenoptera: Aphelinidae) is used as a biological control agent against whiteflies, Trialeurodes vaporariorum (Homoptera: Aleyrodidae). The objective of this lab is to build a model of predator-prey dynamics for E. formosa and T. vaporariorum and to develop a biological control program for management of whiteflies under greenhouse conditions.
We will use the following information on the biology of these species. The whitefly develops from egg to adult in 15 days. In our model we will use the time step of 3 days. Thus, for simplicity, all time intervals are multiples of 3. The sex ratio is 1:1. Whitefly females lays 60 eggs per 3 days. Survival from egg to adult is 0.3, and survival of adult whiteflies is 0.4 per 3 days. Whitefly nymphs of age from 6 to 9 days can be attacked by parasites. Parasites E. formosa are parthenogenetic. Development from egg to adult takes 21 day. Survival of adult parasites is 0.6 per 3 days.
1. Estimate parameters of functional response of parasites using results from the following experiment. Whiteflies were placed in fine-mesh cages with the area of 1 square meter each containing tomato plants. These cages were colonized with whitefly eggs laid on the same day. The parasite attacks host nymphs of age from 6 to 9 days. The density of nymphs in cages was set equal to 50, 100, 200, 500, and 1000 per square meter (per cage). Each prey density was replicated 5 times. When hymphs were 6 days old, 10 parasite females were released in each cage. Hosts were available for parasite attack for 3 days, and then the proportion of parasitized hosts was estimated:
===============================================
Host Density		Proportion Parasitized
===============================================
    50			    0.43
   100			    0.39
   200			    0.29
   500			    0.20
  1000			    0.11
===============================================
Use these data to estimate the search rate, a, (sq.m. per 3 days) of parasites and their reproduction rate, F, per 3 days using the model of Rogers (1972):
where P = 10 is the density of parasites, H is the host density, and T = 3 is the duration of experiment (days). Use the "Solver" tool in Microsoft Excel to find parameters a and F using the least square method (non-linear regression).
2. The next step is to build a host-parasite model. Put parameter names in column A and parameter values in column B. Insert names (Ctrl+F3 or Apple+F3) for cells where parameters values are stored: "aaa" for the search rate of parasites per 3 days, "Fpar" for the oviposition rate of parasites per 3 days, "Fhost" for the oviposition rate of adult whiteflies per 3 days, "Shost" for pre-adult survival of whiteflies, "SApar" for survival rate of adult parasites per 3 days, "SAhost" for survival rate of adult whiteflies per 3 days, and "Fem" for the proportion of females among whiteflies.
Use column C for time: 0, 3,6,... , 150 (time step is 3 days); column D for the density of adult whiteflies, column E for the density of adult parasites, column F for the proportion of parasitized hosts, and column G for the density of released parasitoids. We will assume that 80 parasites are released per sq. meter at time t = 21 and no parasites were released before that or later. 3. First we will write the model for the whitefly population, assuming that there are no parasites. The model can be written starting from time 15 days because this is the duration of the pre-adult development. Whitefly density in time steps 0, 3, 6, 9, and 12, can be set arbitrarily. We will use the following numbers: 0.01, 0.02, 0.03, 0.05, and 0.08. Starting with time t=15, the equation for population dynamics is
where H(t) is the density of whitefly adult females at time t. The first term represents the decline in the numbers of old adults that have survived from the previous time step, and the second term represents newly emerged adult females.
4. The proportion of parasitism at time steps 0 and 3 is set to 0. Starting with time t=6, the proportion of parasitism is estimated using the model of Rogers (see above). To use this equation we need to know the density of hosts that were available for parasite attack at t=6. Because whiteflies can be attacked from age 6 to 9 days, we assume that the density of hosts available for attack at time t was equal to the number of eggs laid 6 days ago (at time t-6) multiplied by preadult survival (we assume that all preadult mortality occurs at early stages). Then the model of Rogers will be:
 ,
,where Fpar is the rate of parasite oviposition per 3 days, Fhost is the rate of whitefly oviposition per 3 days, and Shost is pre-adult survival of whiteflies.
5. Now we will define the dynamics of the parasite population. The density of adult parasites at time 0 is equal to the number of released parasites at time 0: P(0) = R(0), where R(t) is the density of released parasites at time t. At the following time steps (t = 3, 6, ...), the density of adult parasites is:
where Spar is the survival of adult parasites per 3 days. Starting from t = 27 we will incorporate the emergence of the new generation of parasites:
Emergence of new parasites is represented by the second term in this equation. which is equal to the density of hosts available for attack 21 days ago (parasite development takes 21 days) multiplied by the proportion of parasitism 21 days ago. The density of hosts available for attack 21 days ago is equal to the number of host eggs laid (21+6) days ago, [H(t-27)*Fhost], multiplied by their survival, Shost.
6. Finally, we will incorporate parasitism into the population dynamics of whiteflies starting from t = 15:
In this equation, the number of new emerged whitefly adult females, H(t-15)*Fhost*Shost*Fem, is multiplied by their survival from parasitism, [1 - q(t-9)], which happened 9 days ago when these organisms were in the stage that could be attacked by parasites.
7. Plot log-transformed density of hosts and parasites versus time. Use log(N+1) transformation so that zeroes would not cause a problem. What patterns of population dynamics do you see. Explain these patterns. Was the parasite able to keep the density of the host at low level?
8. Try to increase the number of parasites released at t = 21 in order to suppress host density. Why it is impossible to keep host density low even if release rates are very high?
9. Try to release parasitoids later. Did you get a better control of the host population? If yes, explain why.
10. Optimize the release of parasites. We will assume that the economic injury level (EIL) is 100 adult whitefly females (or 200 adults) per square meter. Use Solver tool in Microsoft Excel to find the best strategy for keeping population density below the EIL for 150 days.
Somewhere in the spreadsheet, estimate the maximum density of whiteflies (use function MAX), and the total density of parasites released during 150 days. Also, set the numbers of released parasites equal to 10 parasites per sq. meter for all time steps. Then use Solver to minimize the total density of released parasites by changing the number of parasites released at various times. Set the following 2 conditions: (1) the numbers of released parasites cannot be negative, and (2) the maximum whitefly density is not greater than the EIL. Run the Solver to get the optimum parasite release strategy. Plot the dynamics of parasite release for the optimal strategy. Does the maximum whitefly density exceed the EIL?
Check if the strategy is really the best one. Try to release the same total number of parasites but in a slightly different time. Does the maximum whitefly density exceed the EIL?

