A model of an Outbreak
The eastern spruce budworm (Choristoneura fumiferana) is a forest pest insect. It defoliates spruce stands in Canada and Maine. Outbreaks occur in intervals of 30-40 years. Last outbreaks were in 1910, 1940, and 1970. They resulted in defoliation of 10, 25, and 55 million hectares, respectively.Clark and Holling (1979, Fortschr. Zool. 25: 29-52) developed a simple model of the spruce budworm population dynamics. It includes (1) logistic population growth, and (2) type III functional response of polyphagous predators (birds). Biological background of this model is not very solid because several important factors were ignored (e.g., parasitism, diseases). However, the model captures dynamic features of the system and we will use it as an example of an outbreak models.
 Excel spreadsheet "budworm.xls"
Population dynamics is described by the following differential equation:

Technical details: The second term (predation) is derived from the Holling's disc equation assuming that the search rate of predators is proportional to prey density (a = qN). Then, alpha = qP, and beta = qTh, where P is the density of predators and Th is handling time.
We will start with the following parameter values:
r = 1; K = 1000; alpha = 0.5; beta = 0.04
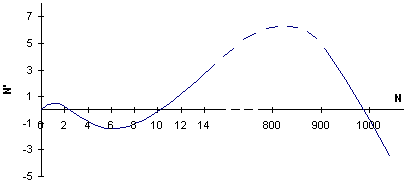
This model describes the start of an outbreak due to escape from natural enemies. The phase plot of the model is show below. There are 2 stable equilibria: at the lower equilibrium (N* = 2.5) population numbers are stabilized by predation, and at the higher equilibrium (N* = 2.5) the population reaches its carrying capacity. The switch point between these equilibria is N = 10.

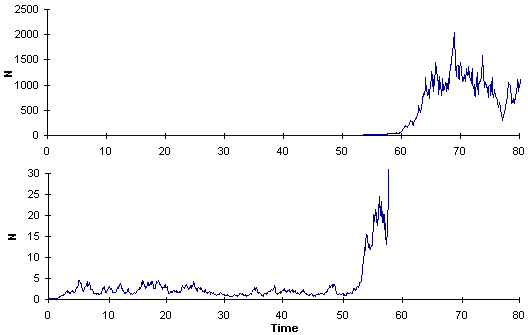
If we run the model with a small environmental noise, we will get the following output:

The population density once came very close to the switch point (N = 10) but then it returned back due to unfavorable conditions at that specific time. If we increase the amplitude of noise, then the population eventually passes the switch point and the outbreak starts. The lower graph is the magnification of the upper graph:

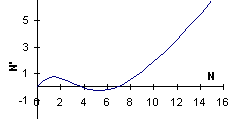
Now we will increase parameter r (intrinsic rate of increase) to the value of r = 1.1. The phase plot changes and the distance between the lower equilibrium and the switch point becomes smaller:

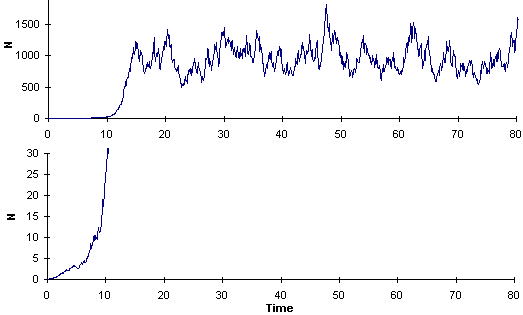
Now the outbreak starts even with a low noise (as in the first graph) and much earlier:

The lower graph is the magnification of the upper graph.
This model does not include mechanisms that may cause the collapse of outbreak populations. Thus, the outbreak continues forever in a model population. In nature, outbreak populations of the spruce budworm cause severe defoliation and destroy the forest. As a result, the population collapses. Interaction of spruce budworm with host trees will be considered in the following section.


