10.2 Lotka-Volterra Model
Lotka-Volterra model is the simplest model of predator-prey interactions. The model was developed independently by Lotka (1925) and Volterra (1926):
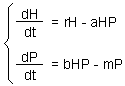
It has two variables (P, H) and several parameters:
H = density of prey
P = density of predators
r = intrinsic rate of prey population increase
a = predation rate coefficient
b = reproduction rate of predators per 1 prey eaten
m = predator mortality rate
Measuring parameters of the Lotka-Volterra model
The following set of experiments should be done:- Keep prey population without predators and estimate their intrinsic rate of increase (r).
- Put one predator in cages with different densities of prey and estimate prey mortality rate and corresponding k-value in each cage. As we know, k-value equals to the instantaneous mortality rate multiplied by time. Thus, the predation rate (a) equals to the k-value divided by the duration of experiment.
Example: lady-beetle killed 60 aphids out of 100 in 2 days. Then, the k-value = -ln(1-60/100) = 0.92, and a = 0.92/2 = 0.46.
Note: if a -values estimated at different prey densities are not close enough to each other, then the Lotka-Volterra model will not work! However, the model can be modified to incorporate the relation of a to prey density. - Estimation of parameters b and m:
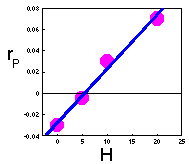 Keep constant density of prey (e.g., H = 0, 5, 10, 20, 100 prey/cage), and estimate the intrinsic rate of predator population increase (rP) at these densities of prey.
Plot the intrinsic rate of predator population increase versus prey density:
The linear regression of this line is:
Keep constant density of prey (e.g., H = 0, 5, 10, 20, 100 prey/cage), and estimate the intrinsic rate of predator population increase (rP) at these densities of prey.
Plot the intrinsic rate of predator population increase versus prey density:
The linear regression of this line is:
Note: If points do not fit to a straight line (e.g., the intrinsic rate of predator population growth may level off), then the Lotka-Volterra model is not adequate and should be modified. Now , parameters b and m can be taken from this regression equation.
How to solve differential equations
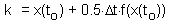
There are two major approaches: analytical and numerical. Analytical methods are complicated and require good mathematical skills. Also, many differential equations have no analytical solution at all. Numerical methods are easy and more universal (however, there are problems with convergence).The simplest and least accurate is the Euler's method. Consider a stationary differential equation:

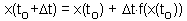
First we need initial conditions. We will assume that at time to the function value is x(to).
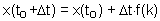
Now we can estimate x-values at later (or earlier) time using equation:
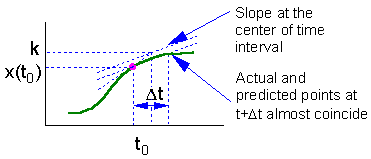
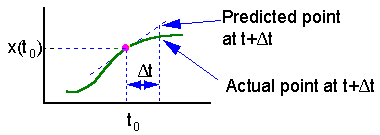 | On this graph we estimate the slope f(x) of the function at point t = to and extrapolate this slope through the entire time interval. |
The main source of error in the Euler's method is estimation of derivative at the start of time interval. The direction of actual solution may change drastically during this time interval and numerically predicted point could be far from the actual solution (see the figure).
Euler's method can be improved, if the derivative (slope) is estimated at the center of time interval  . However, the derivative at the center depends on the function value at the center which is unknown. Thus, first we need to estimate the function value at the middle point using simple Euler's method, and then we can estimate the derivative at the middle point.
k is the function value in the center of time interval l. Finally, we can estimate function value at the end of the time interval:
 |
This is called Runge-Kutta method of second order. The most popular is the Runge-Kutta method of the fourth order. However, for our purposes it is enough to use the second order method. |
This method is applied to Lotka-Volterra equations in the following Excel spreadsheet:
.
 Excel spreadsheet "lotka.xls"
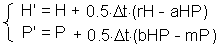
First, we estimate prey and predator densities (H' and P', respectively) at the center of time interval:
The second step is to estimate prey and predator densities (H" and P" at the end of time step l:
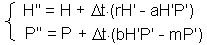
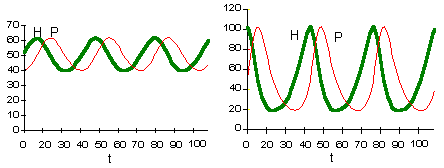
These two graphs were plotted using the same model parameters. The only difference is in initial density of prey. This model has no asymptotic stability, it does not converge to an attractor (does not "forget" initial conditions).
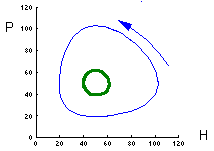
This figure shows relative changes in prey predator density for both initial conditions. Trajectories are closed lines.
The model of Lotka and Volterra is not very realistic. It does not consider any competition among prey or predators. As a result, prey population may grow infinitely without any resource limits. Predators have no saturation: their consumption rate is unlimited. The rate of prey consumption is proportional to prey density. Thus, it is not surprising that model behavior is unnatural showing no asymptotic stability. However numerous modifications of this model exist which make it more realistic.
Additional information on the Lotka-Volterra model can be found at other WWW sites:
- Interactive Simulation Server (Lund)
- Model Description and Realization on "STELLA"
- Model Realization on "Models"
References:
Lotka, A. J. 1925. Elements of physical biology. Baltimore: Williams & Wilkins Co.Volterra, V. 1926. Variazioni e fluttuazioni del numero d'individui in specie animali conviventi. Mem. R. Accad. Naz. dei Lincei. Ser. VI, vol. 2.


