2.3. How Many Samples to Take?
There are two major methods for planning the number of samples:- two-step sampling, and
- sequential sampling:
Two-step sampling
The number of samples, N, required to achieve specific accuracy level can be estimated from equations for standard error (S.E.) and accuracy, A:
where M is sample mean and S.D. is standard deviation. Here the third equation is derived from the first two equations.
Standard deviation, S.D., is usually not known before sampling. Thus, the first step is to take N1 samples and to estimate N using the equation above. Then, at the second step, take N1 = N - N1 samples.
Taking samples in two steps is possible only if population numbers don't change between two sampling dates.
Sequential sampling
The main idea of sequential sampling is to take samples until some condition (which is easy to check) is met.The first example is the sampling plan targeted at achieving specific accuracy. It is based on the Taylor's power law:

Coefficients a and b can be estimated using linear regression from several pairs of M and S.D. estimated in different areas with different average population density. Combining two previous equations we get:

Mean (M) equals to the total number of recorded individuals (S) in all samples divided by the number of samples (N). Now, we substitute M by S/N, and solve this equation for S:

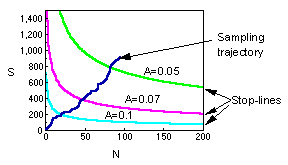
Stop-lines for accuracy levels of A = 0.1; 0.07; and 0.05 are plotted below:

The blue line shows the total number of captured individuals in all samples. Sampling terminates when this line crosses the stop line for selected accuracy level.
The second example is the sequential sampling plan used for decision-making in pest management. This method was developed by Waters (1955; Forest Sci. 1:68-79). It is described in Southwood (1978).

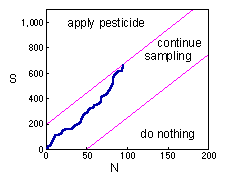
Here the blue line again shows the total number of captured individuals in all samples. While the blue line is between magenta inclined lines, sampling continues. If the blue line crosses the upper magenta line, then sampling stops and pesticides are applied against the pest population. If the blue line crosses the lower magenta line, then sampling stops and pesticides are not applied.
Deriving the solution of this problem it is too complicated. Thus, we will consider the final result only.
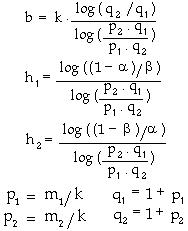
If the population has a negative binomial distribution (see next lecture), then stop lines correspond to the linear equation:

where:


