2.7. Indirect methods (relative estimates)
These are many measures which may correlate with population density: trap catches, visual counts, counts of animal products (frass, nests), proportion of infested hosts (for parasites, in broad sense). Indirect measures can be related to population density using regression analysis (linear or non-linear).Let us remember the basic concepts of regression analysis.
Linear regression:
The least square method is most often used to draw the "best" line through a cloud of points. This method adjusts the values of regression parameters (a and b) so that the residual sum of squares (=sum of square deviations of points from the line) reaches a minimum.
The residual sum of squares is:

The Least Square Method means that we find such parameter values a and b that the value of  is minimized. It follows from the calculus that derivatives at the minimum point are equal to zero:

After substituting of  and simplification:

The total sum of squares is  .
The sum of squares for the factor effect:
  , where the covariance is estimated using equation:

The residual sum of squares:  .
.
R-square is  .
.
Important things in regression analysis
| 1. Significance |  | R = 0.82, N.S.! However, significance does not mean biological significance (e.g., if R = 0.01) |
| 2. Influence diagnistics |  | It is important to check if the most influential points are correct. |
| 3. Outliers |  |
Possible solutions: 1. Ignore an outlier 2. Change regression model 3. leave it as it is |
| 4. Non-linearity |  | Plot data before any regression analysis. Use polynomial or non-linear regression if the relationship is not linear |
| 5. Variable transformation |  | Use transformations only if they are biologically meaningful. It is better to use non-linear models. |
Polynomial regression

This is a non-linear function, but least square estimation leads to a system of linear equations. Thus, this regression is analyzed by a linear method. This is NOT a non-linear regression!
Note: use step-wise regression when you test the significance of non-linear terms in the polynom. The effect is significant if the increment of R-square is large enough according to F-statistics:

where, in the numerator, there is a difference in R-squares estimated in two consecutive steps,  and
and  are corresponding degrees of freedom (d.f.= number of regression coefficients minus 1). The difference
  -
-  is equal to 1 because one term is added at a time.
Nonlinear regression
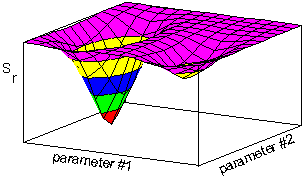
Nonlinear regression is estimated numerically. Residual sum of squares is a function of model parameters. Thus the minimum can be found as a lowest point on the response hyper-surface:
Several methods are used to search for a minimum. Examples are:
- simplex - slow but more reliable
- gradient - faster but not robust
It is desirable that the equation represents some theoretical model of a real system. Then regression coefficients have biological interpretation.
Example. We return back to indirect population measures. Binomial sampling is a method when instead of counting organisms in each sample, we count the number of samples where organisms were present. For example, the density of Colorado potato beetles can be reconstructed from the proportion of potato plants where at least one insect was found. This is a faster method than counting all insects. If we assume the random (poisson) distribution of beetles, then the proportion of infested plants is equal to the zero term po of the poisson distribution:

where M is the mean number of individuals per plant. It is clear that the mean density, M, can be estimated as the negative logarithm from the proportion of infested plants, po.
An alternative theoretical model can be derived from the assumption that beetles are aggregated on host plants and that their distribution is negative binomial. The zero term of the negative binomial distribution is:

where k is the aggregation parameter. To test, which model is better, it is necessary to use the non-linear regression and then to compare R-square.


