3.6. Geostatistical Analysis of Population Distribution
The main idea of geostatistical methods is to relate the spatial variation among population densities to the distance lag. We already used one of geostatistical tools: an omnidirectional correlogram. Here we are going to explore a set of related tools: covariance functions and variograms. Also, we will discuss the phenomenon of anisotropy.
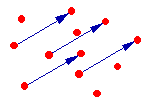
Directional correlogram  is defined as correlation among population counts at points separated by space lag h. The difference from the omnidirectional correlogram is that h is a vector rather than a scalar (that is why it is in bold face). For example, if h={20,10}, then each pair of compared samples should be separated by 20 m in west-east direction and by 10 m in south-north direction:
In practice, it is difficult to find enough sample points which are separated by exactly the same lag vector h. Thus, the set of all possible lag vectors is usually partitioned into classes:
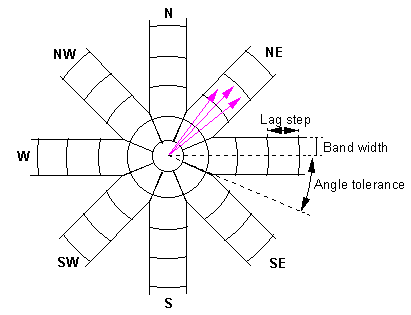
Vectors that end in the same cell are grouped into one class and correlogram value is estimated separately for each class. The number of directions may be different (4, 8, 16, etc.)
Correlogram is estimated using equation:
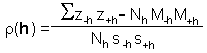
where indexes -h and +h refer to sample points located at the tail and head of vector h;
z
Other measures of spatial dependence are covariance function:
and variogram (=semivariogram):
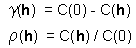
The correlogram, covariance function, and variogram are all related. If the population mean and variance are constant over the sampling area (there is no trend) then:
where C(0) is the covariance at zero lag = variance = squared standard deviation.
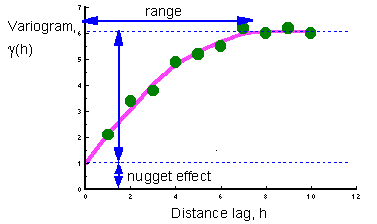
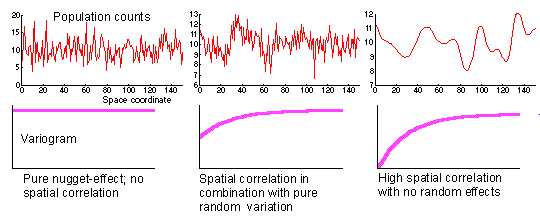
Typical variogram has the following shape:
Interpretation of the nugget effect: It shows the pure random variation in population density (white noise) or it may be associated with sampling error.
Examples of one-dimensional spatial distributions with different nugget effects and corresponding variograms:
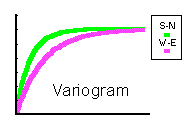
Anisotropy: different spatial relationships in different directions
A variogram with anisotropy and corresponding spatial pattern:
Log-transformation of data may be necessary before variogram estimation:
Transformation is necessary to make the distribution more symmetrical and to remove the trend in variance. In a log-normal distribution, variance is proportional to the mean squared. Thus, in high-density areas, the variance is higher than in low-density areas. After log-transformation the variance becomes uniform.
Note: If zero values are present, use transformation: log(N+1).
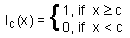
Some times indicator transformation is used:
where c is a threshold value ("a cutoff").
Usually, a series of thresholds is used, and variograms are estimated for all of them. If one threshold has to be selected, then the best is to take the median threshold m which corresponds to the 50% cumulative probability distribution.
![]()